


The stock market, as measured by the S&P 500 Index
SPX,
is testing its support level at 4200, which is also roughly the location of the 200-day Moving Average of SPX.
At the beginning of October, SPX retreated to these same levels, and an oversold rally occurred. But that rally topped out at the declining 20-day Moving Average (as most oversold rallies do), and now we are testing support again. Actually, SPX has fallen below both 4200 and the 200-day Moving Average. That movement has produced another lower low on the chart, to go along with the lower highs. That pattern of lower highs and lower lows is a distinct downtrend on the SPX chart, and that makes the chart bearish (red lines on chart). Thus, we are still holding a “core” bearish position.
The green “B” on the accompanying SPX chart is a McMillan Volatility Band (MVB) buy signal, which occurred in early October, and which is still in effect. It would be stopped out if SPX closes below the -4σ Band, which is currently at about 4150 and declining. In fact, that lower Band is running right along the lower downtrend line on the SPX chart.
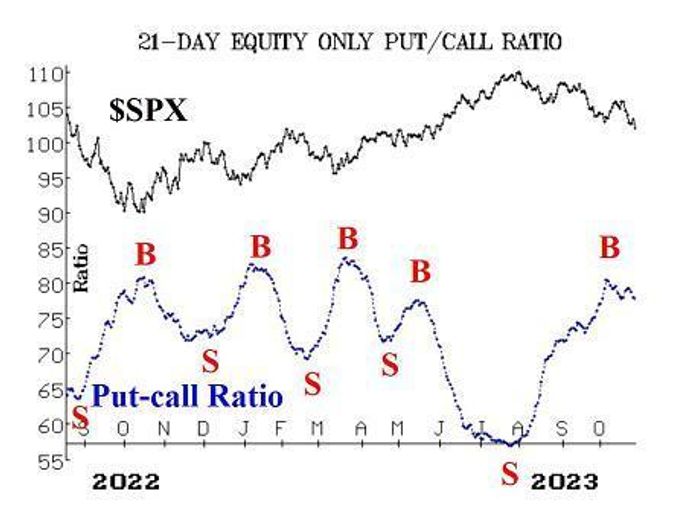
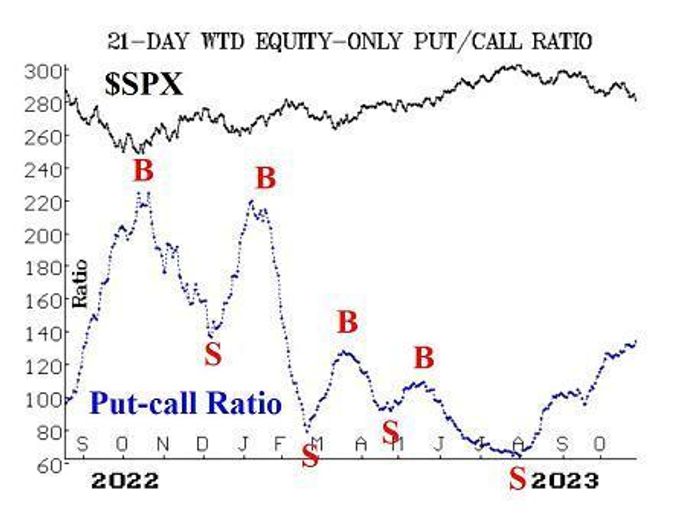
Equity-only put-call ratios are mixed, with the standard ratio having been on a buy signal (incorrectly) for a couple of weeks, while the weighted ratio refuses to confirm and thus remains on a sell signal. On Wednesday, the weighted ratio moved to a new relative high, which means it is still on a sell signal. The total put-call ratio (sum of equity and index options) is nearing a buy signal as well. Of these three, the weighted equity-only is the one that has been most in tune with what the market is doing, and so until that gives a buy signal, there is still some doubt about the market emanating from these important sentiment indicators.
Market breadth has been horrific in the past week. As a result, both breadth oscillators are on sell signals. Yes, they are heavily oversold, but that alone is not a buy signal. We would need to see at least two consecutive days of positive breadth in order to generate buy signals from these breadth oscillators.
New Lows on the NYSE have been extremely large in number — topping 400 on three separate days recently. This indicator, probably more than most, shows how devastating this market decline is for many stocks. These stocks are now making new bear market lows, as they are trading below October 2022 prices. That is a far cry from the much more optimistic readings given by SPX and NDX
NDX,
which include the few tech stocks that have been doing very well. The Russell 2000 Index
RUT
is nearing a new bear market low.
This is what the “average” investor is suffering with. Needless to say, this indicator (New Highs vs. New Lows) remains on a sell signal. That sell signal will only be stopped out if New Highs on the NYSE outnumber New Lows for two consecutive days.
VIX
VIX
VX00,
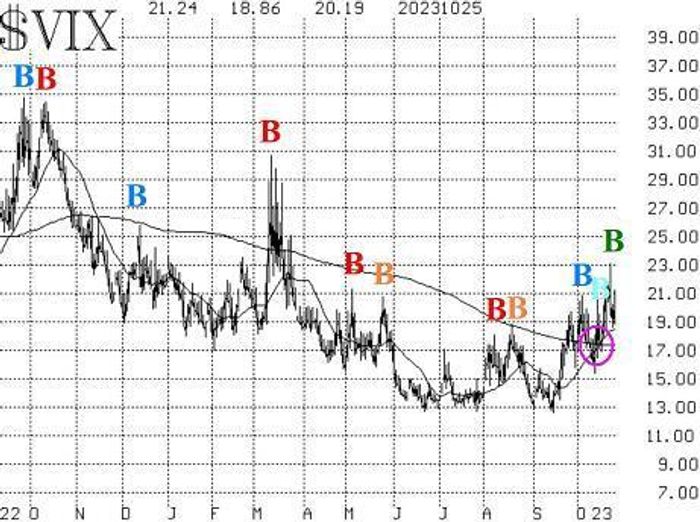
is now generating two different signals. The trend of VIX sell signal occurred last week (circle on the accompanying VIX chart), when both VIX and its 20-day Moving Average rose above the 200-day MA. They have remained there, so this intermediate-term signal remains negative. This sell signal would be stopped out if VIX were to close below the 200-day MA, which is about 17.30 and moving sideways now.
Countering that, VIX rose to 23 this week, and then quickly fell back to 18, generating a “spike peak” buy signal. It is marked as a green “B” on the VIX chart. That buy signal will remain in effect for 22 trading days or until VIX closes above its most recent high of 23.08 (which would stop out the trade).
The construct of volatility derivatives is in a very tenuous state, as the front-month November VIX futures are trading a few pennies higher than the December VIX futures. If November rises significantly above December (say, by 50 cents or more), that would be another negative sign for stocks. Meanwhile, the term structure of the CBOE Volatility Indices is showing weakness as well: the nine-day VIX (VIX9D) is now higher than VIX and is higher than the three-month VIX (VIX3M). That is a modest oversold condition.
Perhaps about to provide some relief to what has become a pretty negative market is the fact that there is a strong seasonal bullish pattern at the end of October. It will begin with the close on Friday, October 27th. It only lasts a week or so, but there doesn’t seem to be much else that’s capable of lifting this market right now.
In summary, we are still holding a “core” bearish position and are trading both buy and sell signals around that.
Market insight: October seasonal trade
Stock market conditions have changed in the past week: SPX has fallen far enough to trigger the setup for the October seasonal trade. That is, SPX has declined more than 3.2% sometime during the month of October. This trade is simple: buy “the market” at the close on October 27th and sell your position at the close on November 2nd. It has to do with fiscal year-end adjustments by mutual funds. It seems to work best if there has been a somewhat substantial decline prior to that, in October.
The track record over the past 45 years has been 31 wins and six losses. The other eight years there was no trade because there had not been the requisite decline by SPX prior to October 27th. The average gain is 2% by SPX, and the median gain is 1.6% (there was one huge positive year — in 2008, in the midst of the Financial Crisis, no less).
At the close of trading on Friday, October 27th, buy 2 SPY Nov (10th) at-the-money calls
Take a partial profit on half your calls if they become at least six points in-the-money. Then sell all of your (remaining) calls at the close of trading on Thursday, November 2nd.
New recommendation: Consumer Staples SPDR (XLP)
This recommendation was not filled last week, but remains open for the coming week, since XLP
XLP
is toying with the entry point. The basis for this recommendation is repeated below.
A McMillan Volatility Band (MVB) buy signal has been issued by this ETF (yes, the MVB signals can be applied to any chart). It has a good track record of buy signals, so we are going to act on this signal.
IF XLP closes above 68.04, then buy 4 XLP Dec (1st) 68 calls in line with the market.
XLP: 67.94
If bought, the position would be stopped out if XLP closed below its -4σ “modified Bollinger Band.” We will update the situation weekly. The target is for XLP to trade at the upper +4σ Band, which is currently at 70, but which would reverse upward if XLP begins to rally. See the similar buy signal about a year ago on the XLP chart.
Follow-up action:
All stops are mental closing stops unless otherwise noted.
We are using a “standard” rolling procedure for our SPY spreads: in any vertical bull or bear spread, if the underlying hits the short strike, then roll the entire spread. That would be roll up in the case of a call bull spread, or roll down in the case of a bear put spread. Stay in the same expiration and keep the distance between the strikes the same unless otherwise instructed.
Long 1 SPY
SPY
Nov (10th) 420 put: was originally bought in line with the equity-only put-call ratio sell signals. We are going to hold a put until the weighted ratio rolls over to a buy. Last week we, rolled out to the 428 put, and then when SPY traded at 420 (which was 8 points in-the-money – ITM), we rolled do to this put. Continue to roll down every time the put becomes 8 points ITM. In essence, this is our “core” bearish position.
Long 2 EQR
EQR,
Nov (17th) 60 puts: Continue to hold as long as the weighted put-call ratio for EQR remains on a sell signal.
Long 1 SPY Nov (20th) 420 put: Established in line with the “New Highs vs. New Lows” sell signal. Stop out if New Highs outnumber New Lows on the NYSE for two consecutive days. Last week, we rolled to the 428 puts, and then rolled down when SPY traded at 240. Continue to roll down every this put becomes 8 points ITM.
Long 3 CHEF
CHEF,
Nov (17th) 20 puts: The trailing stop remains at 20.20.
Long 2 DLR
DLR,
Nov (10th) 118 puts: Hold these puts as long as the DLR weighted put-call ratio is on a sell signal.
Long 0 SPY Nov (17th) 430 call and Short 0 SPY Nov (17th) 445 call: This position was bought in line with the VIX “spike peak” buy signal of October 6th. It was stopped out on October 20th, when VIX closes above 20.88.
Long 3 XLE
XLE
Nov (17th) 86 puts: Hold as long as the weighted put-call ratio of XLE remains on a sell signal.
Long 1 SPY Nov (17th) 434 call short 1 SPY Nov (17th) 452 call: This spread was bought in line with the CBOE Equity-only put-call ratio buy signal. We are holding without a stop initially. Roll the whole spread up if the long side becomes at least 8 points in-the-money.
Long 3 ES
ES,
Nov (17th) 60 calls: we will hold this position as long as the weighted put-call ratio chart for ES remains on a buy signal.
All stops are mental closing stops unless otherwise noted.
Send questions to: [email protected].
Lawrence G. McMillan is president of McMillan Analysis, a registered investment and commodity trading advisor. McMillan may hold positions in securities recommended in this report, both personally and in client accounts. He is an experienced trader and money manager and is the author of the best-selling book, Options as a Strategic Investment. www.optionstrategist.com
©McMillan Analysis Corporation is registered with the SEC as an investment advisor and with the CFTC as a commodity trading advisor. The information in this newsletter has been carefully compiled from sources believed to be reliable, but accuracy and completeness are not guaranteed. The officers or directors of McMillan Analysis Corporation, or accounts managed by such persons may have positions in the securities recommended in the advisory.
Read the full article here


